Data insight · Nov 11, 2026 · 6 min read
The 10-year yield fell from 5.31% to 4.88%. Bitcoin fell 14% with it, the reverse of September
In September bitcoin climbed 14% while the ten-year Treasury yield pushed to 5% for the first time since 2007. Since 5 October the yield has fallen 0.43 points and bitcoin has fallen 14%. The textbook says lower yields help an asset that pays nothing. This autumn ran both halves of the textbook backwards.
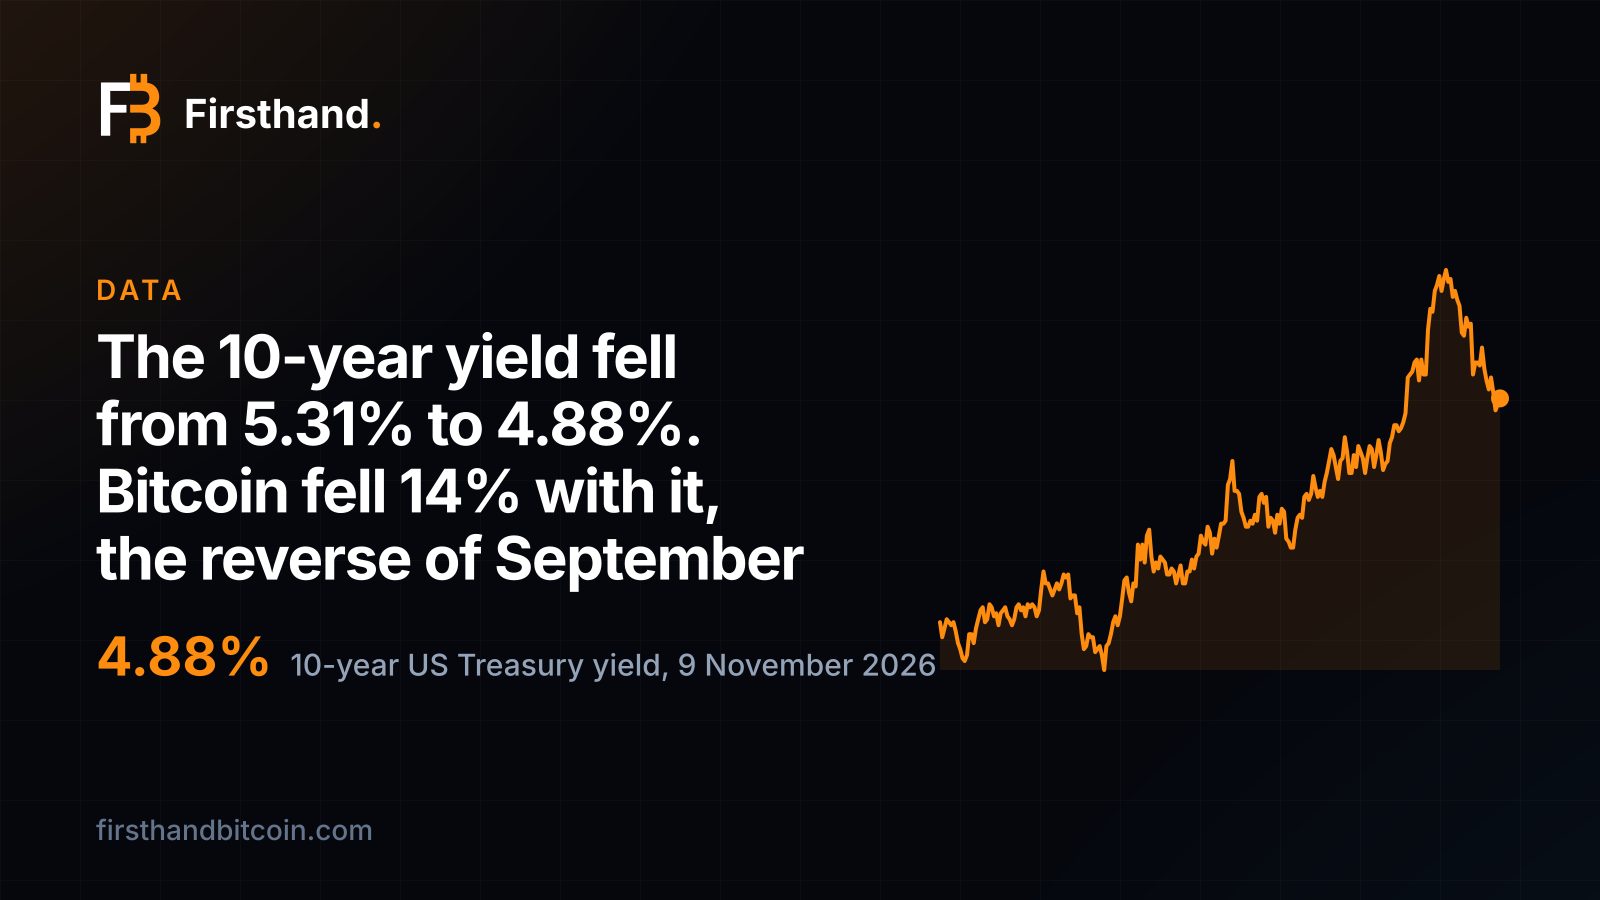
Yields peaked on 5 October, and so did bitcoin
The ten-year US Treasury yield closed at 5.31% on 5 October, the highest close in our series, which runs back to 2020. The thirty-year closed at 5.67% two days later. Between 15 September and 28 October the ten-year closed at or above 5% on 26 days, something it had not done since 2007. Bitcoin closed at $86,488 on 5 October, within $120 of its 22 September high.
Both have come down since. The ten-year closed at 4.88% on 9 November, the latest reading on FRED, 0.43 points under its peak. The thirty-year was 5.26%. Bitcoin closed at $74,707 on 9 November on our price chart, 13.6% under its 5 October close.
Over five weeks the yield on the safest asset in the world fell by almost half a point, and the asset that is supposed to benefit most from cheaper money lost an eighth of its value.
In September the same two lines ran the other way
The ten-year first closed at 5% on 15 September. Bitcoin's lowest close of that month came the next day, at $75,787. Six days later it closed at $86,608, up 14%, while the yield sat at 4.96%. It then climbed to its 5.31% peak over the next two weeks and bitcoin held above $83,000 the whole way. We wrote up that stretch in the macro paradox: long yields were rising because buyers wanted more to hold the debt of a government running $2 trillion deficits, and that was not the headwind that 2022's rate rises had been.
The reverse leg has now run. From 5 October to 9 November the ten-year fell 0.43 points and bitcoin fell 13.6%. Over the two legs together the yield is 0.12 points lower than on 15 September and bitcoin is 1.4% under its 16 September close. The relationship that was supposed to hold did not hold in either direction.
Yields rising on fiscal worry did not hurt bitcoin. Yields falling have not helped it.
What changed is why yields are moving
Short rates are going up, not down. The Federal Reserve held its policy rate at 3.75% to 4% on 28 October, by a vote of ten to two, with governors Lisa D. Cook and Beth M. Hammack preferring a quarter-point rise. On 10 November the Bureau of Labor Statistics reported consumer prices up 0.4% in October, a tenth above forecast, and CME FedWatch put the odds of a quarter-point rise on 9 December at 85.3%, with the rest on a half point, Cointelegraph reports.
Long yields fell anyway, because money was running to safety. The same report has the Nasdaq opening lower on 10 November, Nvidia down nearly 4%, and the equity put-to-call ratio above 1.0, higher than during the April 2025 trade-war selloff. A bond bought for safety pushes its yield down; a bitcoin sold for the same reason pushes its price down. The dollar did not drive it: the Fed's broad dollar index was 121.3 on 5 October and 121.9 on 6 November.
Our Fear & Greed Index tells the same story from the other side. It read 70 on 5 October and 29 on 9 November. September's rise in yields was buyers asking more to hold US debt. November's fall is buyers paying up for the safety of it. The first was not a headwind for bitcoin. The second is.
Lower yields have never been a reliable bid
We checked the whole record before calling this unusual, and it is not. Since 2020 the ten-year yield has dropped 0.35 points or more inside five weeks on ten earlier occasions. Bitcoin was higher over the same five weeks in six of them: April 2020, July 2022, February 2023, April 2023, December 2023 and June 2024. It was lower in four: March 2020, December 2022, August 2024 and March 2025. In the two biggest drops, March 2020 and December 2022, bitcoin fell 12% and 14%.
A falling long yield has been a sign of fear about as often as a sign of relief, and bitcoin has traded on the fear. The macro reading that fits the data is not that rates drive bitcoin, in either direction. It is that the reason rates move drives both.
What it means for a miner
A miner who keeps the coins pays for electricity in dollars, and a dollar in a ten-year bond now earns 4.88% rather than 5.31%. The hurdle a mined coin has to outrun over the life of the machine is lower than it was five weeks ago.
The coins themselves moved less than the price. Hashprice, what a petahash earns in a day, was $41.17 on 5 October and $32.10 on 10 November, down 22%. The bitcoin behind that figure fell 10%, from 0.000476 to 0.000427 a day, and all of that was the two difficulty rises of October. The next reset is on course to cut difficulty 6.9% in about two days, which hands each petahash about 7% of those coins back.
On 10 November the most efficient machine in stock, the S23 XP Hyd, makes a bitcoin for about $19,520 of electricity at Nigeria's 3.9 cents a kilowatt-hour, against a market price of $73,940 this morning: about 26% of the price. A lower price and a difficulty cut together are when an efficient machine on cheap power stacks the most coins per dollar. Earnings are not guaranteed, and these figures hold today's conditions flat.
The hurdle a mined coin has to clear fell with the yield. The cost of making one did not rise.
Sources and further reading
- 10-Year Treasury Constant Maturity Rate (DGS10) — FRED, Federal Reserve Bank of St. Louis, 9 Nov 2026
- Federal Reserve issues FOMC statement — Federal Reserve, 28 Oct 2026
- Consumer Price Index – October 2026 — US Bureau of Labor Statistics, 10 Nov 2026
- Bitcoin retests $73,500 on high US CPI inflation, Nvidia stock drops 4% — Cointelegraph, 10 Nov 2026
- US Treasury yields — Firsthand Bitcoin data, 9 Nov 2026
- Hashprice — Firsthand Bitcoin data, 10 Nov 2026
Disclosure
Firsthand Bitcoin sells and hosts mining hardware, including this machine. No manufacturer, distributor or affiliate programme paid for or reviewed this page and we take no commission on the links above. Historical figures are computed from daily bitcoin price and network hashprice, each day valued at its own prices. Nothing here is investment advice.