Data insight · Oct 7, 2026 · 5 min read
The 10-year yield passed its 2007 peak, and bitcoin is up 47% since June
The ten-year Treasury yield closed at 5.31% on 5 October, above the 2007 peak. In 2022 a climb like this meant a falling bitcoin. This year yields rose in six months and bitcoin fell in only two. The longer record says the old rule was never a rule.
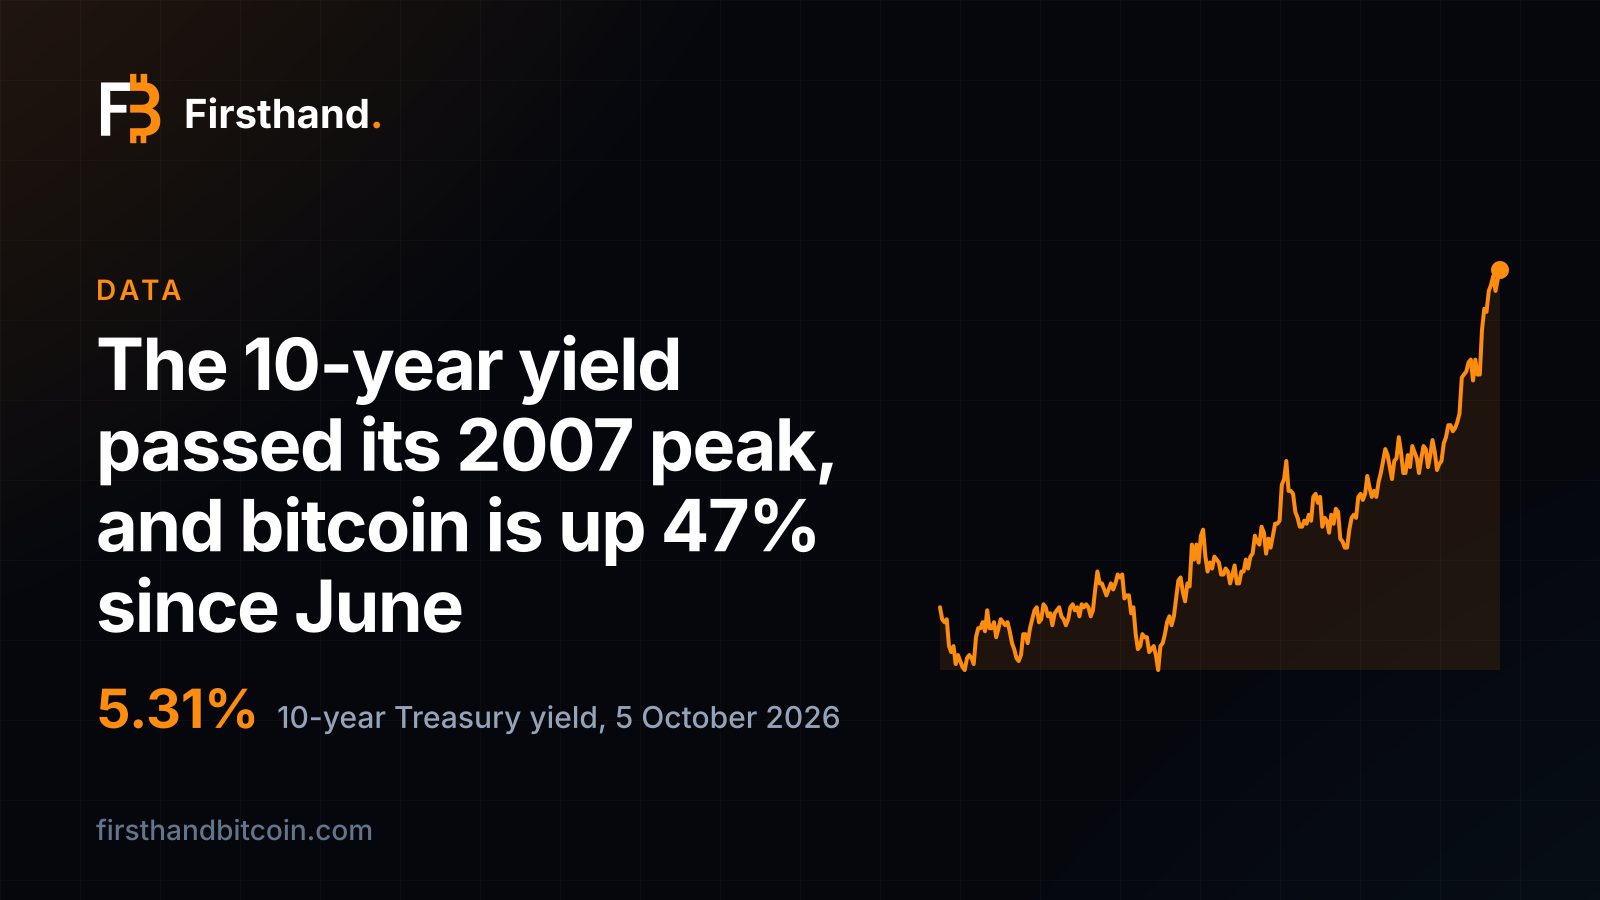
The 10-year yield closed at 5.31%, above its 2007 peak
On 5 October the ten-year US Treasury yield closed at 5.31%, according to the Treasury’s daily rates table. The highest close of the 2007 cycle was 5.26%, on 12 June 2007, as 24/7 Wall St reported when the yield first cleared it on 30 September. A year ago, on 6 October 2025, the same yield was 4.18%. It eased to 5.27% on 6 October. A ten-year bond at 5.31% pays $5.31 a year for every $100 lent, and that is the rate every other asset is measured against, including a bitcoin that pays no income at all.
Our Treasury yields chart goes back to 2013, and 5 October is the highest close anywhere in it. The ten-year has climbed 0.87 points since the end of June, from 4.44% to 5.31%. The thirty-year closed at 5.66% on 5 October, up from 4.91% on 30 June.
In 2022, rising yields meant falling bitcoin
Anyone who traded 2022 remembers the rule. Measured from month-end to month-end on our series, the ten-year yield rose in nine of that year’s twelve months, and bitcoin fell in six of them. Over the whole year the yield went from 1.52% to 3.88% while bitcoin went from $47,289 to $16,541, a fall of 65%.
The two biggest monthly jumps in the yield in the 164 months we hold both came that year: 0.57 points in April, when bitcoin lost 16.3%, and 0.68 points in September, when it lost 3.4%. The reason was a central bank draining money out of the system, which we set out in the macro paradox. A market that lived through it came out believing yields up means bitcoin down.
Two months in 2022 hold the biggest yield jumps in our record. Bitcoin fell in both.
This year the same move has not done the same thing
September 2026 was the third-biggest monthly jump in the ten-year yield in our record: 0.54 points, from 4.75% to 5.29%. Only April and September 2022 were bigger. Bitcoin rose 6.8% over the month, from $78,303 to $83,629.
It is not one month. The yield rose in six of the nine completed months of 2026, and bitcoin fell in two of them, January (−5.9%) and May (−3.5%). In the three months where the yield jumped by a quarter of a point or more, March, July and September, bitcoin rose every time: 1.2%, 7.7% and 6.8%.
The year’s biggest moves in bitcoin did not come with big moves in yields. February lost 19.8% while the yield fell 0.29 points, from 4.26% to 3.97%, so lower rates did not help. June lost 19.7% with the yield flat, and August gained 23.1% with the yield barely changed. The price was being moved by something other than the bond market, which the flows and liquidations on our Data section have shown through the autumn.
Since 30 June the yield has gone from 4.44% to 5.31%, and bitcoin from $59,014 to $86,488, up 46.6%.
The rule was never a rule
Take every month since 2013 in which the ten-year yield rose. There are 87 of them, and bitcoin fell in 38, or 44%. In the 24 months where the yield rose by a quarter of a point or more, bitcoin fell in 10. Neither number looks like a rule. In the 74 months the yield fell, bitcoin fell in 30, or 41%, and the median month gained 4.4%, against 4.1% in the months the yield rose. The two groups are almost the same. 2022 was the year the coin landed the same way six times, and it taught a market a lesson the longer record does not hold.
What changes the result is why yields are rising. A yield pushed up by a central bank draining money hurt bitcoin in 2022. A yield pushed up by buyers asking more to hold government debt, the case we made in our September piece, has not so far. Nothing here says next month will go the same way.
Over 87 months of rising yields, bitcoin fell in 38. That is close to a coin toss.
What it means for a miner
A miner who keeps the coins pays for electricity in dollars, so the yield is the honest price of waiting. At the 5 October close of 5.31% and bitcoin’s $86,488, a year in a ten-year Treasury pays about $4,600 on the value of one coin.
The cheapest way we know to hold a coin is to make it. On 7 October the most efficient machine in stock, the Antminer S23 XP Hyd, on 3.9¢ power in Nigeria, turned about $18,000 of electricity into a bitcoin that costs about $86,000 to buy. On that $18,000 the same 5.31% is under $1,000 a year. The figure is electricity only, at today’s hashprice, before the machine and the pool fee.
Meanwhile the coins per petahash barely moved. Hashprice was 0.000474 bitcoin per petahash per day on 30 June and 0.000476 on 5 October, so efficient machines on cheap power stacked about the same coins through a quarter in which the yield climbed from 4.44% to 5.31%. Those coins are worth 47% more than they were on 30 June: $27.95 per petahash per day then, $41.17 now. Output is not guaranteed, and moves with difficulty and price.
The yield is the price of waiting. A coin that is cheap to make makes waiting cheap.
Sources and further reading
- Daily Treasury Par Yield Curve Rates, October 2026 — US Department of the Treasury, 6 Oct 2026
- The 10-Year Yield Just Broke Its 2007 Peak. Here Is What Comes Next — 24/7 Wall St, 1 Oct 2026
- Market Yield on U.S. Treasury Securities at 10-Year Constant Maturity (DGS10) — FRED, Federal Reserve Bank of St. Louis, daily
Disclosure
Firsthand Bitcoin sells and hosts mining hardware, including this machine. No manufacturer, distributor or affiliate programme paid for or reviewed this page and we take no commission on the links above. Historical figures are computed from daily bitcoin price and network hashprice, each day valued at its own prices. Nothing here is investment advice.