Data insight · Oct 18, 2026 · 6 min read
Bitcoin's hashrate reading is off by more than 10% on one day in four
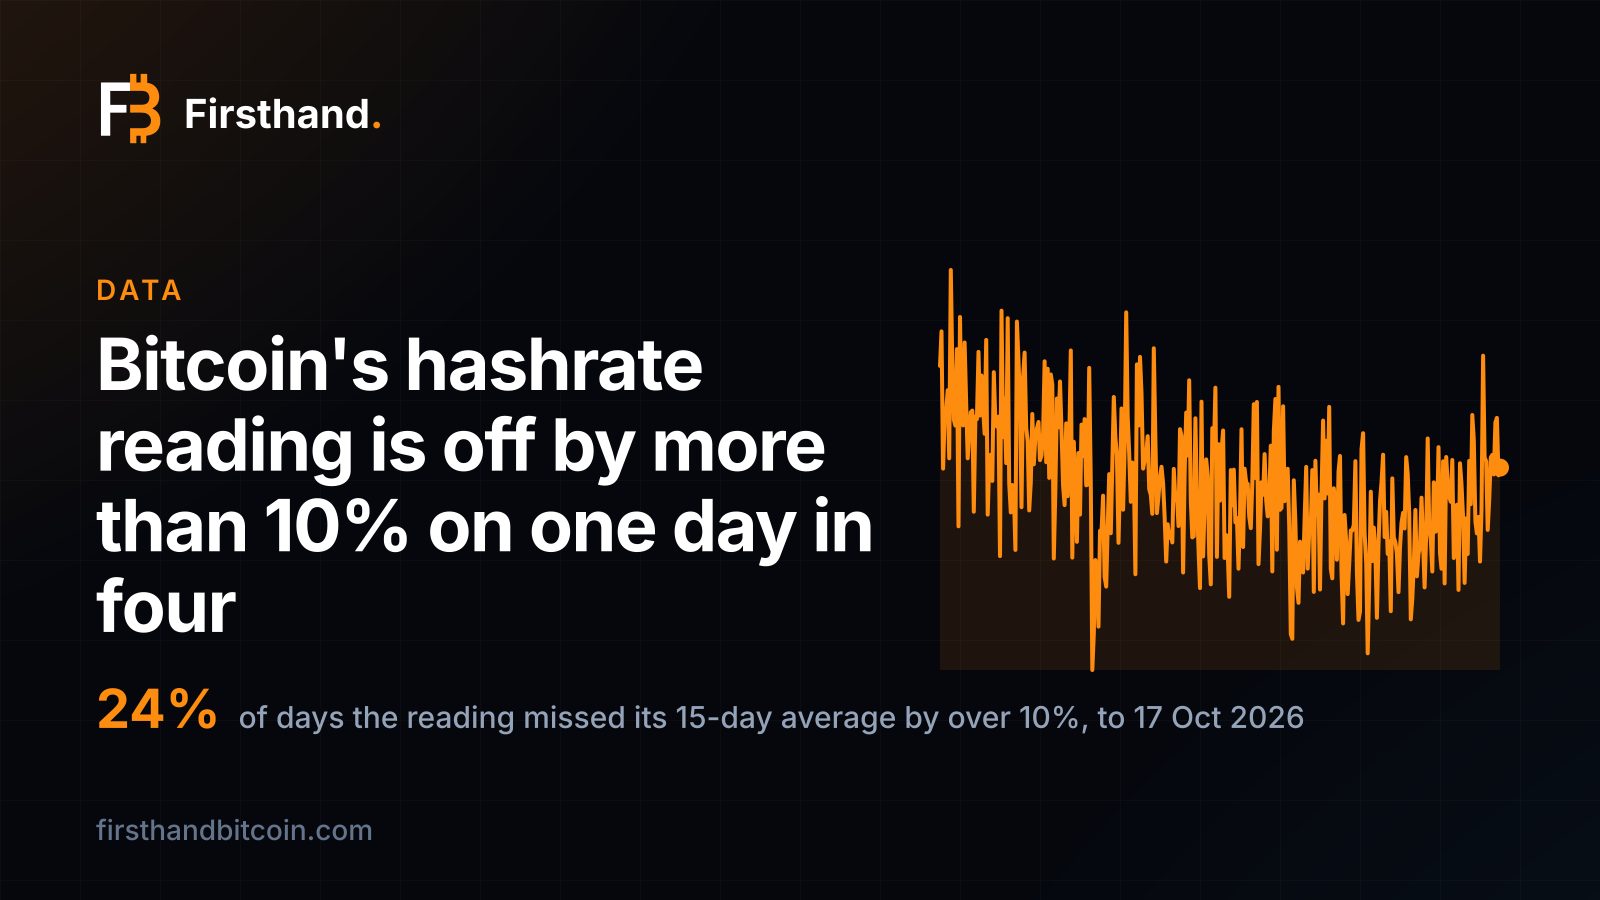
Hashrate is not measured. It is estimated from how fast blocks arrive, and blocks arrive by luck. In the year to 17 October the daily reading sat more than 10% from the average of the days around it on 24% of days. The record day, 1,306 exahashes, was a lucky one.
Nobody measures hashrate, it is worked out from blocks
No machine reports its hashrate to the network. What the chain records is when each block was found, and how hard the puzzle was at the time. Hashrate is the number that would explain those two facts: if blocks came faster than usual against a given difficulty, more machines must have been working. The estimate on our hashrate chart is built that way, and its own notes say that single days swing by 10% or more on luck alone.
The luck is in the blocks. The network aims for one every ten minutes, 144 a day, but each block is a lottery that any machine can win at any moment. Over the 365 days to 17 October the average was 143.4 blocks a day, right on target, and the range was 98 to 197. Nothing about the network had to change for a day to land at either end of that range. The draw did.
The protocol does not react to any of this day by day. The Bitcoin developer guide says the rule plainly: “Every 2,016 blocks, the network uses timestamps stored in each block header to calculate the number of seconds elapsed”, and the ideal is “1,209,600 seconds (two weeks)”. Difficulty moves once a fortnight, on a count of blocks, and a count of 2,016 blocks smooths out most of the luck.
Over a year, the reading missed its own average by more than 10% on one day in four
To put a number on the noise, we compared each day's reading with the average of the 15 days around it: seven before, seven after and the day itself. It is the plainest answer to “where was hashrate, really, around then?”. From 18 October 2025 to 10 October 2026, the last day with seven days still to come, that comparison covers 358 days.
On 87 of them, 24%, the reading was more than 10% above or below that average. On 24 days, 7%, it was more than 15% away, and on three it was more than 20%. The two most extreme came two days apart: the reading was 23% above its surroundings on 23 January 2026 and 25% below on 25 January.
The week-on-week view is as bad. Comparing each day's reading with the same weekday a week earlier, it moved 8% or more in either direction on 201 of the 365 days, 55%. A headline that says hashrate has risen or fallen 8% in a week would have been true more often than not, and meant nothing most of the time.
The daily reading moved 8% or more from the week before on 201 of 365 days.
Two weeks in October: a 35% jump and a 5.9% rise
The fortnight just finished is a clean example, because difficulty did not change inside it. The retarget on 3 October set difficulty at 132.7 trillion, and it stayed there until the next one, on 16 October.
Inside that window the daily reading went from 869 exahashes a second on 4 October to 1,177 on 6 October, a rise of 35% in two days. It then spent the rest of the fortnight between 916 and 1,084. The 14 days from 4 to 17 October average 1,010 exahashes, and the gap between the highest and lowest reading is 31% of that average.
Nobody plugged in 300 exahashes of machines in 48 hours and then unplugged them. What the network actually did was measured on 16 October by the retarget, which counts the real time it took to find 2,016 blocks. Difficulty rose 5.9%. That is the fortnight's true growth, and it is about a sixth of the size of the jump that the daily line drew. Our earlier piece on why difficulty was due to rise 6% has the arithmetic.
The record is a lucky day
The highest single reading in our series is 1,305.7 exahashes on 25 October 2025. The highest 14-day average is 1,134.4, reached a day later, on 26 October. The record day sits 15% above the record average, which tells you how much of the “record” was the draw falling kindly.
The same gap shows at the bottom. The lowest reading of the year was 706.1 exahashes on 25 January 2026, and the lowest 14-day average, on 6 February, was 874.7. A day that looked like a quarter of the network switching off was 19% under the lowest average the year produced.
As of 17 October the 14-day average is 1,009.6 exahashes, 11% below the record average. Difficulty, which counts every block rather than a day's worth, stands about 10% below its own record; we followed that gap in difficulty is still below its peak. Both measures say the network is a little smaller than it was a year ago, and neither is changed by a single good or bad day.
What to read instead
Two numbers do the job the daily line cannot. The first is a longer average. The 14-day average of the same series moved by 8% or more from one week to the next on only seven days in the past year, against 201 for the single-day reading. It is the same data, with the luck taken out.
The second is difficulty, which is not an estimate at all. It is reset by counting blocks, and it is the number a machine's earnings are actually measured against. In the 26 retargets since 18 October 2025 the median move was 2.4%, and 18 of them were within 5%. Eight were bigger than 5%, the largest being 14.7% on 19 February 2026. When hashrate really changes, difficulty is where it shows up, two weeks at a time.
A daily line is still useful for one thing: spotting a regime. A reading that stays below the average for two weeks running, or a block count that sits well under 144 for days, is a signal. One day below the line is not.
The 14-day average moved 8% in a week on 7 days all year. Difficulty moves once a fortnight.
What it means for a miner
A machine's earnings are its share of the roughly 450 new bitcoin a day, 144 blocks of 3.125. Its share is its own hashrate against everything else that is hashing, and that everything else is priced in through difficulty, not through the daily chart. When a headline says hashrate fell 8%, the number to check is the next difficulty adjustment, which would only fall if machines really had left, and which would then lift every remaining machine's coins.
What a coin costs to make moves with difficulty and the price of power, and not with a lucky day. The most efficient machine we stock, the Antminer S23 XP Hyd at 8.9 J/TH, makes a bitcoin for about $17,900 of electricity at Nigeria's 3.9¢, against a market price of $81,640 on 18 October. That figure is electricity only, at today's hashprice, and output is not guaranteed.
The practical rule is to judge a miner and a network on averages: a fortnight of hashrate, one retarget of difficulty, and the efficiency of the machine. Our guide to difficulty explains how a step changes what a machine earns, and the blocks-per-day chart shows how the current window is running.
Sources and further reading
- Block Chain: Bitcoin Developer Guide — Bitcoin.org developer documentation, Accessed 18 Oct 2026
Disclosure
Firsthand Bitcoin sells and hosts mining hardware, including this machine. No manufacturer, distributor or affiliate programme paid for or reviewed this page and we take no commission on the links above. Historical figures are computed from daily bitcoin price and network hashprice, each day valued at its own prices. Nothing here is investment advice.