Data insight · Oct 4, 2026 · 4 min read
At its June low, bitcoin was still 10% above its holders' average cost. Earlier lows were not.
Bitcoin's 2026 fall took the price down 53% and stopped 10% above the average price its holders paid. In 2015, 2018 and 2022 the price went 25% to 44% below it. The cost basis under bitcoin held while the price came back.
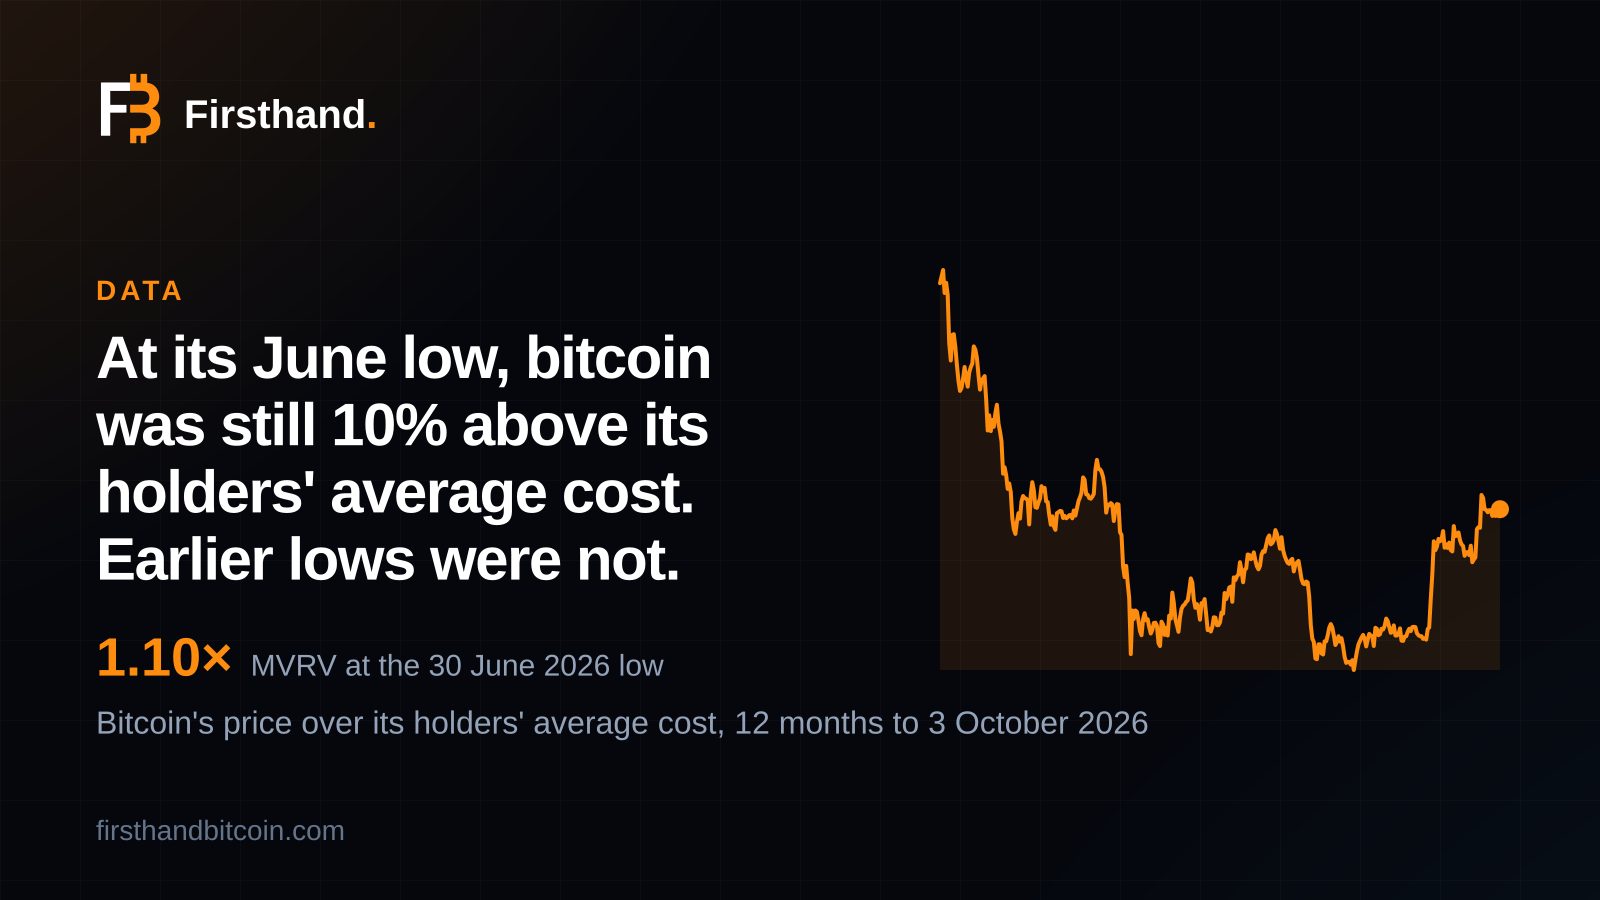
On 30 June bitcoin was still 10% above what its holders paid
Bitcoin closed at $59,014 on 30 June 2026, the lowest close of its fall from $124,493 on 6 October 2025. That day the price stood 10% above the average price at which every bitcoin last moved. The ratio of the two, which on-chain analysts call MVRV, read 1.10.
It has not been lower since. On 3 October, the latest reading we hold, bitcoin closed at $84,503 and the ratio was 1.58. The price is 58% above the average holder's cost.
That is not what the previous three cycle lows looked like. In each of them the price fell below the average holder's cost and stayed there for weeks or months. This time it never got there. The depth of the fall is in our piece on the shallowest bear market; this one is about the floor it did not break.
The average holder's cost is a price you can chart
Coin Metrics, which publishes the series, defines realised capitalisation as “valuing each unit of supply at the price it last moved on-chain”. Divide that by the coins in circulation and you have the realised price: what the average bitcoin cost the person holding it now, measured at the moment it last changed hands.
A coin that last moved at $20,000 counts at $20,000 even if it trades at $85,000 today. Coins that move often are re-priced often. Coins that sit still keep their old price, so the realised price moves slowly.
Our realised price chart draws it against the market price. Through 2025 and 2026 the market line went from $124,493 to $59,014 and back to $84,503, and the realised line barely moved.
Realised price values every coin where it last moved, so the whole network gets one cost basis.
Three earlier cycle lows went 25% to 44% under it
From the 2013 peak to the January 2015 low, bitcoin fell 85%, from $1,137 to $172. MVRV bottomed at 0.56 on 14 January 2015, when the price of $222 was 44% below the average holder's cost.
From the December 2017 peak to the December 2018 low it fell 82%, from $18,912 to $3,308. MVRV reached 0.69 on 15 December 2018.
From the November 2021 peak to the November 2022 low it fell 76%, from $67,534 to $15,930. MVRV reached 0.75 on 9 November 2022, with the price at $17,499 against a realised price of $23,210.
The sharpest short fall on record agrees. In March 2020, when bitcoin fell almost a third in a week, MVRV touched 0.88 on 12 March and was under 1 on six days that month.
Across the 5,024 days we hold, MVRV was below 1 on 623 of them, 12% of the record. The last of them was 12 January 2023, at 0.96. In the 2025–26 fall the price dropped 53%, less than any of those three, and the ratio stopped at 1.10.
The cost basis stood still while the price doubled
The realised price was $53,643 on 30 September 2026. At each month end since October 2025 it has sat between $53,489 and $56,521. On 11 March 2024 it was $25,575, so it has more than doubled in two and a half years and then stopped.
The ratio itself tells the same story from the other side. At the 6 October 2025 high close of $124,493 it read 2.29, meaning the average holder was sitting on a gain of 129%. By 30 June it had compressed to 1.10, a gain of 10%. By 3 October it was back to 1.58. The cushion shrank by more than half and was never used up.
A floor that stays level while the price climbs away from it is a floor the price never had to test. At the June low, holders in aggregate were still sitting on a gain, which is the condition that was missing at every earlier low, when the whole network held bitcoin at a loss.
The data does not say whether it will stay that way. What it does say is that the 2026 fall ended in a different place from the three before it, and that the place was above the cost basis, not below.
What it means for a miner
Put three prices next to each other. On 4 October the most efficient machine in stock, an Antminer S23 XP Hyd at 8.9 J/TH, running on the cheapest power we host, in Nigeria at 3.9¢ per kilowatt-hour, makes a bitcoin for about $18,000 in electricity at today's hashprice. The average holder's cost is about $53,500. The market price is $84,744.
That is the gap the coins you keep sit in. A miner who keeps what the machine produces is holding coins that cost a fraction of what the average holder paid, and the price they are held at is set by the same market that stopped above that average at its low.
Nothing here promises output. Difficulty and hashprice move, and what a machine mines changes with them. But the shape of the 2026 fall is the useful part: the price came down 53% and the cost basis under it did not give way. The hashprice guide shows how to read what a machine earns, and the realised price and MVRV charts update every day.
A coin costs about $18,000 to make, $53,500 on average to hold, and $84,744 to buy.
Sources and further reading
- Coin Metrics' State of the Network: Issue 41 - Using MVRV To Analyze Investor Behavior — Coin Metrics, 10 Mar 2020
Disclosure
Firsthand Bitcoin sells and hosts mining hardware, including this machine. No manufacturer, distributor or affiliate programme paid for or reviewed this page and we take no commission on the links above. Historical figures are computed from daily bitcoin price and network hashprice, each day valued at its own prices. Nothing here is investment advice.