Data insight · Oct 30, 2026 · 4 min read
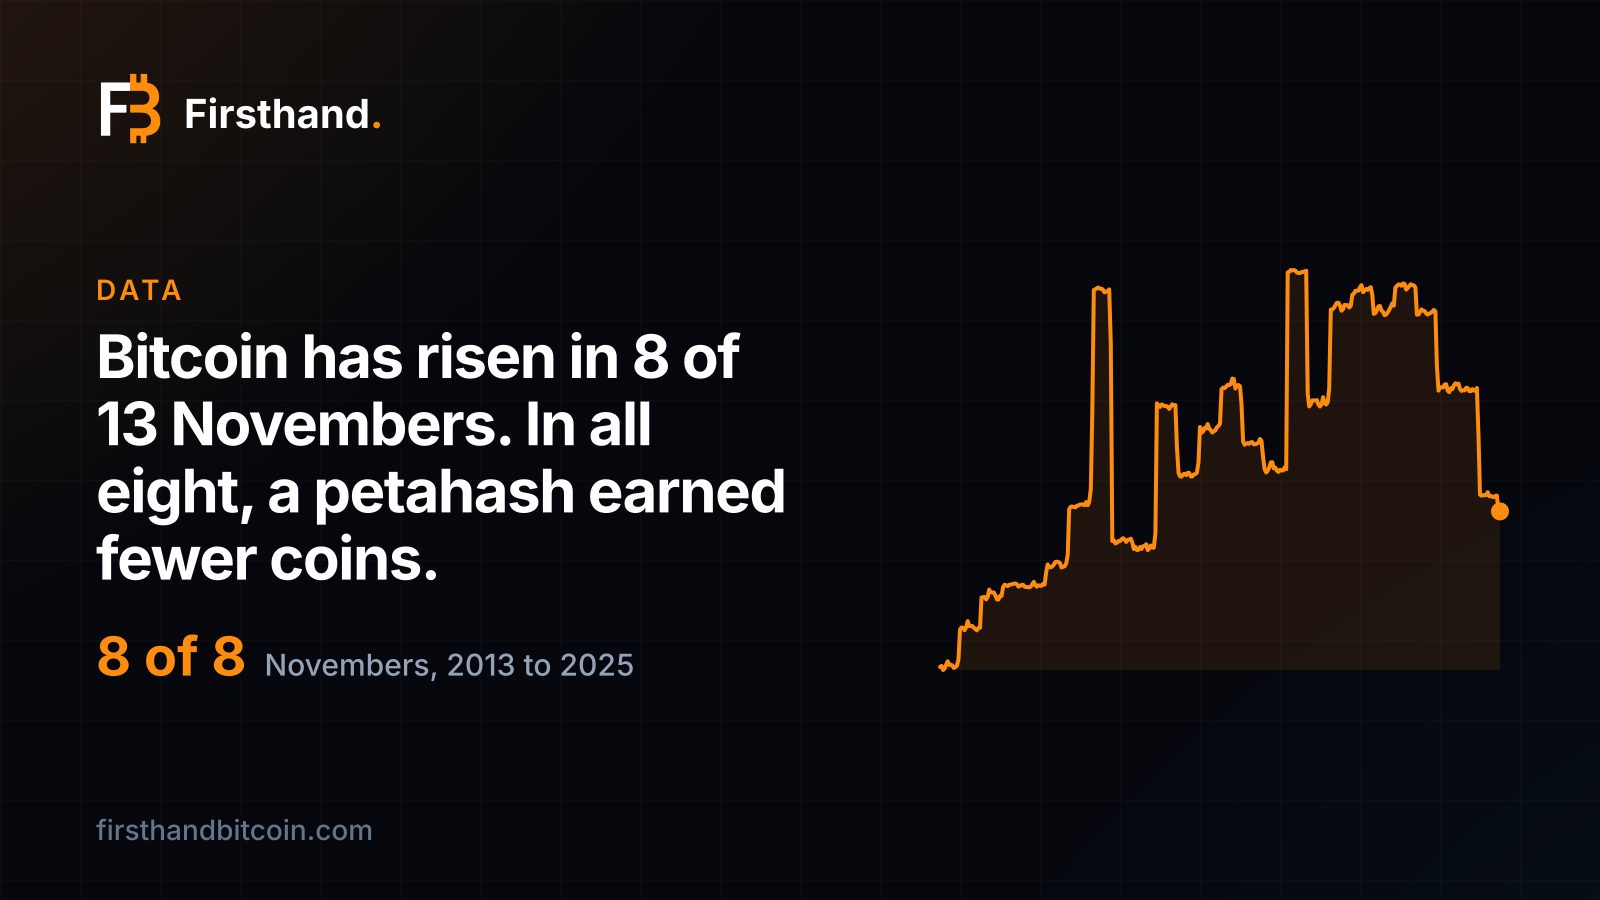
Bitcoin has risen in 8 of 13 Novembers. In all eight, a petahash earned fewer coins.
November is called bitcoin's strongest month, but its average is one year. The part that repeats is on the mining side: whenever the price rose, the network added machines and each petahash earned fewer bitcoin. When it fell, the count held up.
The average November is one year
Measured from the last close of October to the last close of November in our daily series, bitcoin rose in eight of the thirteen Novembers from 2013 to 2025. The average gain was 39.9%, which is why November has the name of the strongest month: Cointelegraph, citing CoinGlass, puts the average at 40.82%.
That average is mostly 2013, when bitcoin gained 450% in the month. Leave that year out and the other twelve average 5.7%. Thirteen Novembers is a small sample, and one of them is 2013. The median of all thirteen is 8.8%, the same figure Yahoo Finance reached when it looked at the record. The losing Novembers lost more than the typical one gained: 36.4% in 2018, 20.6% in 2019, 17.6% in 2022 and 16.8% last year.
October, the month that rises, is ending lower
October has risen in ten of those thirteen years, by a median of 15.4%, as we showed in our October piece. This year is on course to join the three that fell. Bitcoin closed September at $83,629 and closed 29 October at $81,275, down 2.8%. Our latest reading on 30 October, $77,990, is 6.7% under the September close.
A calendar says what usually happened. It does not push the price, and the count of machines does not read it either, which is the part worth following.
When bitcoin rose in November, every petahash earned fewer coins
Hashprice in bitcoin is the number of coins one petahash of mining power earns in a day. Comparing the week ending 30 November with the week ending 31 October, it fell in all eight of the Novembers that bitcoin rose. The median fall was 13.1%, from 2.0% in 2023 to 37.6% in 2013.
The hashrate column shows why. In seven of the eight, network hashrate rose, by a median of 12.1%. A higher price pays more machines to switch on, and every new machine takes a share of the same 450 or so coins that blocks pay out each day. The exception is 2024, when hashrate slipped 5.4% but fees paid to miners fell from 21 bitcoin a day to 12, and the coins per petahash fell with them.
| November | Bitcoin | Coins per petahash | Network hashrate |
|---|---|---|---|
| 2013 | +450.4% | −37.6% | +58.7% |
| 2014 | +8.8% | −6.3% | +6.1% |
| 2015 | +13.1% | −15.0% | +17.7% |
| 2016 | +4.7% | −11.2% | +13.2% |
| 2017 | +62.6% | −34.6% | +11.0% |
| 2018 | −36.4% | +26.2% | −17.5% |
| 2019 | −20.6% | −0.2% | +1.2% |
| 2020 | +31.5% | −16.0% | +15.7% |
| 2021 | −6.1% | −10.7% | −2.4% |
| 2022 | −17.6% | +0.8% | −7.9% |
| 2023 | +9.8% | −2.0% | +9.2% |
| 2024 | +35.3% | −8.5% | −5.4% |
| 2025 | −16.8% | −0.4% | −6.3% |
In dollars, a rising November paid less than it looked
Counted in dollars, hashprice is coins earned times the price of a coin. In the eight Novembers that bitcoin rose, the median price gain was 22.3%. The median change in dollars per petahash was 3.9%.
Only four of the eight paid a petahash more than 1% extra in dollars: 2013, 2020, 2023 and 2024. In 2014, 2015, 2016 and 2017 it finished within 4.1% of where it began, because the machines that arrived took back what the price had added.
In the five falling Novembers, dollar hashprice fell every time, by a median of 19.6%. The coin count was the part that held. A miner who keeps the coins is paid in the unit that moved least, and the dollar figure is what the exchange rate says about it on the day.
When it fell, the coins held up
The five Novembers that bitcoin fell run the other way. Coins per petahash rose in two of them (26.2% in 2018, 0.8% in 2022) and ended within half a percent of where they started in two more, 2019 and 2025. Only 2021 lost, by 10.7%.
Hashrate fell in four of the five: 17.5% in 2018, 7.9% in 2022, 6.3% in 2025 and 2.4% in 2021. Machines that cannot pay at the lower price switch off, and the ones that stay share the same coins between fewer of them. A falling price is when an efficient machine on cheap power takes a larger share.
Price moves the dollars. The count of machines moves the coins.
This October the machines kept coming anyway
October is the month that did not follow it. Difficulty rose 5.9% at the retarget on 16 October and 5.5% on 29 October, 11.8% in two steps, as average network hashrate in the last week of October ran about 10% above the last week of September. Bitcoin slipped 2.8% over the same stretch.
A petahash earned 5.9% fewer coins as a result: 44,865 satoshis a day in the week to 29 October, against 47,684 in the week to 30 September. The machines kept arriving with the price near $80,000.
What it means for a miner
Eight Novembers up and five down is all the record offers, and it says nothing about this one. What it does show is what each case does to a machine's share: a rising price dilutes every petahash as hashrate arrives, and a falling one thins the network and gives the share back.
Either way the machine that makes a coin most cheaply keeps its margin. On our cost-to-mine chart, the most efficient machine we stock, the Antminer S23 XP Hyd at 8.9 J/TH on Nigeria's 3.9¢ power, makes a bitcoin for about $18,700 of electricity, against a market price of about $78,000 on 30 October. That counts electricity only, at today's hashprice, and output is never guaranteed. Why efficiency decides how long a machine keeps earning is in our guide to halvings and J/TH.
The calendar moves the price. Efficiency and power set how many coins you make.
Sources and further reading
- Bitcoin looks red again this month, but demand may stir soon: Bitfinex — Cointelegraph, 26 Nov 2025
- Is November the New October? Here's What Bitcoin Price Data Actually Shows — Yahoo Finance, 1 Nov 2025
Disclosure
Firsthand Bitcoin sells and hosts mining hardware, including this machine. No manufacturer, distributor or affiliate programme paid for or reviewed this page and we take no commission on the links above. Historical figures are computed from daily bitcoin price and network hashprice, each day valued at its own prices. Nothing here is investment advice.