Data insight · Nov 8, 2026 · 5 min read
The average bitcoin last moved at $54,000; the best machine makes one for $19,500
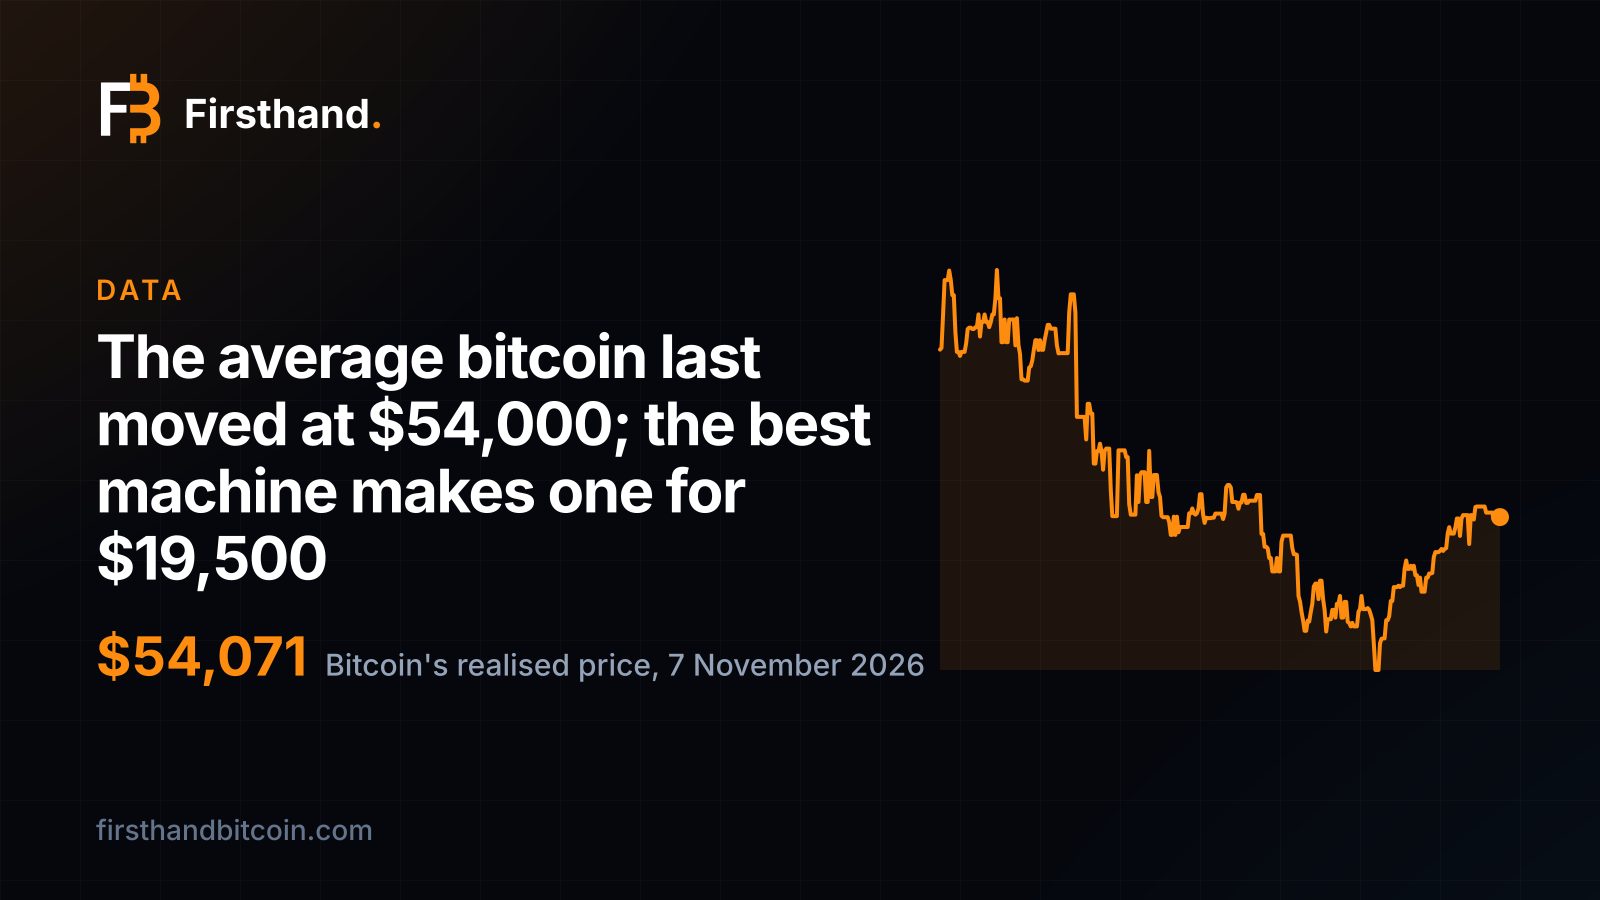
Value every bitcoin at the price it last moved and the network's average coin sits at about $54,000, 29% below the market price and barely changed since May. Price has stayed above that line for 1,395 days, and the electricity for a coin is a third of it.
A price for the average coin, not the last trade
The market price values every bitcoin at what the last coin sold for. Realised price does something different: it values each coin at the price it was at when it last moved on the blockchain, then averages them. Coin Metrics, which created the measure, describes it as "an estimation of the aggregate cost basis of a cryptoasset". A coin that has not moved since 2017 counts at its 2017 price.
On 7 November 2026 our realised price chart reads $54,071. Bitcoin closed that day at $75,745. Divide one by the other and you have the MVRV ratio, 1.40: the market price sits 40% above the network's average cost basis, or put the other way, the average coin is 29% below the price. For price to fall to the realised line it would have to lose 29%.
The cost basis stood still while the price swung
Realised price is slow because it only changes when coins move. On 31 December 2025 it was $56,573. On 1 May it was $53,757, on 30 June $53,634, on 1 October $53,268, and on 7 November $54,071. Across that stretch the market price closed at $88,169 on the last day of 2025, rose to $96,275 on 15 January, fell to $59,014 on 30 June and is back at $75,745.
From 31 December to 7 November the price is down 14.1% and the realised price is down 4.4%. That is the shape of a market where most coins sit still while a smaller part trades around them. The price moves a lot because the marginal coin sets it; the cost basis moves a little because the average coin has not been sold.
It also explains why the ratio is a measure of distance rather than of direction. MVRV was 1.56 on 31 December, 1.70 on 15 January, 1.10 on 30 June and 1.58 on 1 October. Those swings are almost entirely the numerator.
Price lost 14% this year. The average coin's cost basis moved 4%.
30 June: the closest price came to the line
The closest price came to the average coin's cost this year was 30 June, when bitcoin closed at $59,014 and the ratio fell to 1.10. That is the lowest reading since 11 March 2023, when it was 1.04. On our MVRV chart it is the dip in the middle of 2026, and it did not touch 1.
The ratio was under 1.2 on 39 days, from 5 February to 16 August. By 1 October it was back at 1.58, and it has eased to 1.40 since, as the price fell 9.4% from $83,571 and the realised price rose 1.5%.
Every earlier low went under the line
Our series starts in 2013, and in that time the ratio has been under 1 on 623 days. They were all in the downturns that followed the peaks of 2013, 2017 and 2021 and the pandemic crash of March 2020: 20 days in 2014, 284 in 2015, 43 in 2018, 91 in 2019, 6 in 2020, 167 in 2022 and 12 in January 2023.
The deepest readings were 0.56 on 14 January 2015, 0.69 on 15 December 2018, 0.88 on 12 March 2020 and 0.75 on 9 November 2022. Since 13 January 2023 the ratio has not been under 1. That is 1,395 days from the last sub-1 reading to 7 November 2026, and the 2026 low of 1.10 is well above any of those lows.
A ratio above 1 does not say a low is in. From its 15 January close to its 30 June close the price fell 38.7% without touching the line, because the line itself was almost flat. What the series records is that, so far, this cycle's drawdown against cost basis has been shallower than any of the earlier ones. Who held the coins through it is something the ETF holdings chart can show, which is a story for another day.
What it means for a miner
The line a holder watches is $54,071. The line a miner watches is lower. The most efficient machine in our store, the Antminer S23 XP Hyd at 8.9 J/TH, makes a coin for about $19,500 of electricity at our Nigeria rate, with hashprice as it stood on 8 November. That is roughly a third of the realised price and about a quarter of the market price.
For the price to reach the electricity bill on that machine it would have to fall about three quarters. For it to reach the average holder's cost it would have to fall 29%. The cushion between those two numbers is what a miner keeps when sentiment sours, which is why the Fear & Greed Index at 25 on 7 November does not change the cost of the next coin.
A miner who keeps the coins also keeps a cost basis that is far below the network's average. That is the arithmetic behind nobody selling the coins to pay the power bill. Output is never guaranteed, but the cost of each coin is known, and on the best machine it is a third of what the average coin was last worth. Efficient machines on cheap power are the ones that turn a quiet, low-sentiment market into more coins in the wallet.
The average coin's cost basis is nearly three times what the best machine spends in electricity to make one.
Sources and further reading
- Coin Metrics' State of the Network: Issue 41 – Using MVRV To Analyze Investor Behavior — Coin Metrics, 10 Mar 2020
Disclosure
Firsthand Bitcoin sells and hosts mining hardware, including this machine. No manufacturer, distributor or affiliate programme paid for or reviewed this page and we take no commission on the links above. Historical figures are computed from daily bitcoin price and network hashprice, each day valued at its own prices. Nothing here is investment advice.