Data insight · Oct 29, 2026 · 4 min read
Bitcoin dipped under its 200-week average for 24 days this summer, and is now 20% above it
From 6 June to 17 August bitcoin closed under its 200-week average on 24 days, the first time since October 2023 and far shallower than 2022's, never more than 5.5% under. The average has since climbed to $67,181, and a coin costs under a third of it to make.
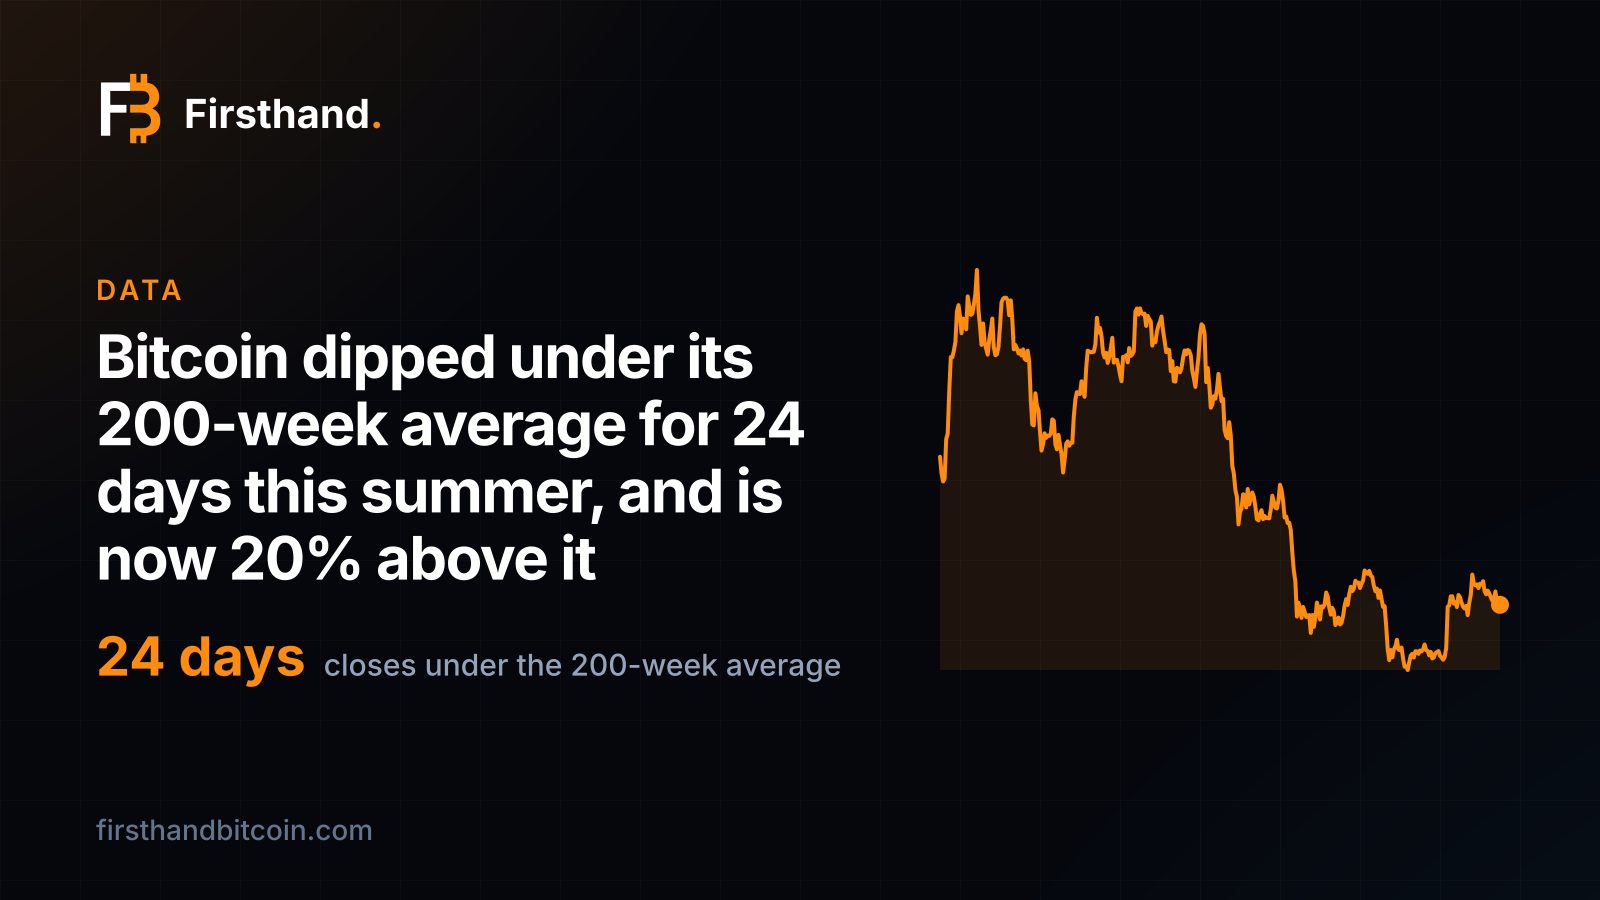
Bitcoin closed under its 200-week average on 24 days this summer
The 200-week average is the mean of the last 1,400 daily closes, a little under four years of prices. It moves slowly: a month of trading barely shifts it. That is why traders treat it as a floor, a line the price has to fall a long way to reach, and one that is easy to read on a chart because it only ever moves gradually.
In 2026 it did reach it. Bitcoin's close was under the 200-week average on 24 days between 6 June and 17 August, across seven separate stretches. The deepest was 30 June, when bitcoin closed at $59,013.56 against an average of $62,451.69, 5.5% under. Galaxy Digital's research head Alex Thorn put the bear market's end in June, with the low under $58,000; our series holds daily closes, so its lowest is the $59,014.
It had not happened since October 2023, and never this shallowly
Our price record gives a 200-week average from 31 October 2016, the first day with 200 weeks of closes behind it. In the nine years since, bitcoin has closed under it on 345 days, in three clusters.
The first was three days in March 2020. The second was the long one: 318 days between June 2022 and October 2023, when the price fell to $15,930 on 22 November 2022, 33.6% under an average of $23,973. The third is this summer. After the last close under it on 16 October 2023, the price stayed above for 963 days, until 6 June 2026.
Of the two real episodes, 2026 was the short, shallow one. Measured against its average, bitcoin's worst day of the year was a 5.5% miss. In 2022 it was a 34% miss.
In 2022 the price fell 34% under its 200-week average. In 2026 the worst miss was 5.5%.
| Episode | Days closed under | Deepest day | Under the average by |
|---|---|---|---|
| March 2020 | 3 | 18 March, $5,358 | 2.4% |
| June 2022 – October 2023 | 318 | 22 November 2022, $15,930 | 33.6% |
| June – August 2026 | 24 | 30 June, $59,014 | 5.5% |
The floor has risen 23% in a year
The average is a record of what bitcoin has traded at, so it climbs whenever today's price is above what is dropping out of the window. It was $40,309 on 28 October 2024 and $54,424 on 28 October 2025. On 28 October 2026 it was $67,181, up 23% on the year.
Bitcoin closed at $80,808.65 that day, 20.3% above it. That is a long way from the 5.5% under of 30 June, and 72 days have passed since the last close below. The moving averages chart draws the line and the price together, and the dip shows as a short, shallow notch in a year when the line itself was rising.
The faster 200-day average was lost for 290 days, and has held since 20 August
The 200-week average is the slow line. The 200-day average, the mean of the last 200 closes, is the fast one, and it tells the longer story of this year. Bitcoin closed under it every day from 3 November 2025 to 19 August 2026: 290 days, the fourth-longest such run in our record.
It has closed above it on every day since 20 August. On 28 October the 200-day average was $73,040 and bitcoin was 10.6% over it. The summer's 24 days under the slow line fell inside the last weeks of that long spell under the fast one, and the price climbed out of both within a few weeks of each other.
In 2022 miners added machines under the floor. In 2026 they switched them off
Difficulty, the measure of how much hashing the network holds, went opposite ways in the two episodes. From 14 June 2022, the first close under the average, to 16 March 2023, the last in that run, it rose 43.8%. Miners kept installing machines through the 2022 low.
From 6 June to 17 August 2026 it fell 8.3%, from 138.96 trillion to 127.48 trillion on our difficulty chart. It has since won back 10.3%, to 140.58 trillion on 28 October. We have written about why that run was different in miners paid below their yearly average for 310 days and about how difficulty has won back half of its fall.
The price recovery from the low brought the machines back. Bitcoin's close went from $59,014 on 30 June to $80,809 on 28 October, up 36.9%. Hashprice in bitcoin, what a petahash earns in coins a day, went from 0.000474 to 0.000449 over the same stretch, down 5.1%, because the extra machines share the same issuance. The dollar value of a petahash's day went up. The coins in it eased.
What it means for a miner
A slow average is a reminder of how far a coin has to fall before it reaches what the network has paid for it over four years. At $67,181 that figure is simply what four years of closes average to.
A machine's own number is lower. On our best case, an Antminer S23 XP Hyd at 8.9 J/TH on Nigeria's 3.9¢ power, electricity makes a bitcoin for about $18,538 at today's hashprice, 28% of the 200-week average and 23% of the $79,857 price on 29 October. That is electricity only, and output is not guaranteed.
The price dipped under its floor for 24 days and came back. Through those weeks a machine with a low cost to make a coin kept making coins for a fraction of their price, as it does at every price. Coins kept are the ones that count.
A coin costs about 28% of the 200-week average to make, with electricity on Nigeria's power.
Sources and further reading
- Now is the time to accumulate bitcoin, Galaxy says — CoinDesk, 27 Oct 2026
Disclosure
Firsthand Bitcoin sells and hosts mining hardware, including this machine. No manufacturer, distributor or affiliate programme paid for or reviewed this page and we take no commission on the links above. Historical figures are computed from daily bitcoin price and network hashprice, each day valued at its own prices. Nothing here is investment advice.