Data insight · Oct 28, 2026 · 4 min read
Miners were paid below their yearly average for 310 days, and the network shrank
From 13 November 2025 to 18 September 2026 the dollar value of what miners earn sat under its one-year average, the third-longest such run in our record. In the six earlier long ones difficulty rose every time. This time it fell 13%, and each petahash that stayed earned 20% more bitcoin.
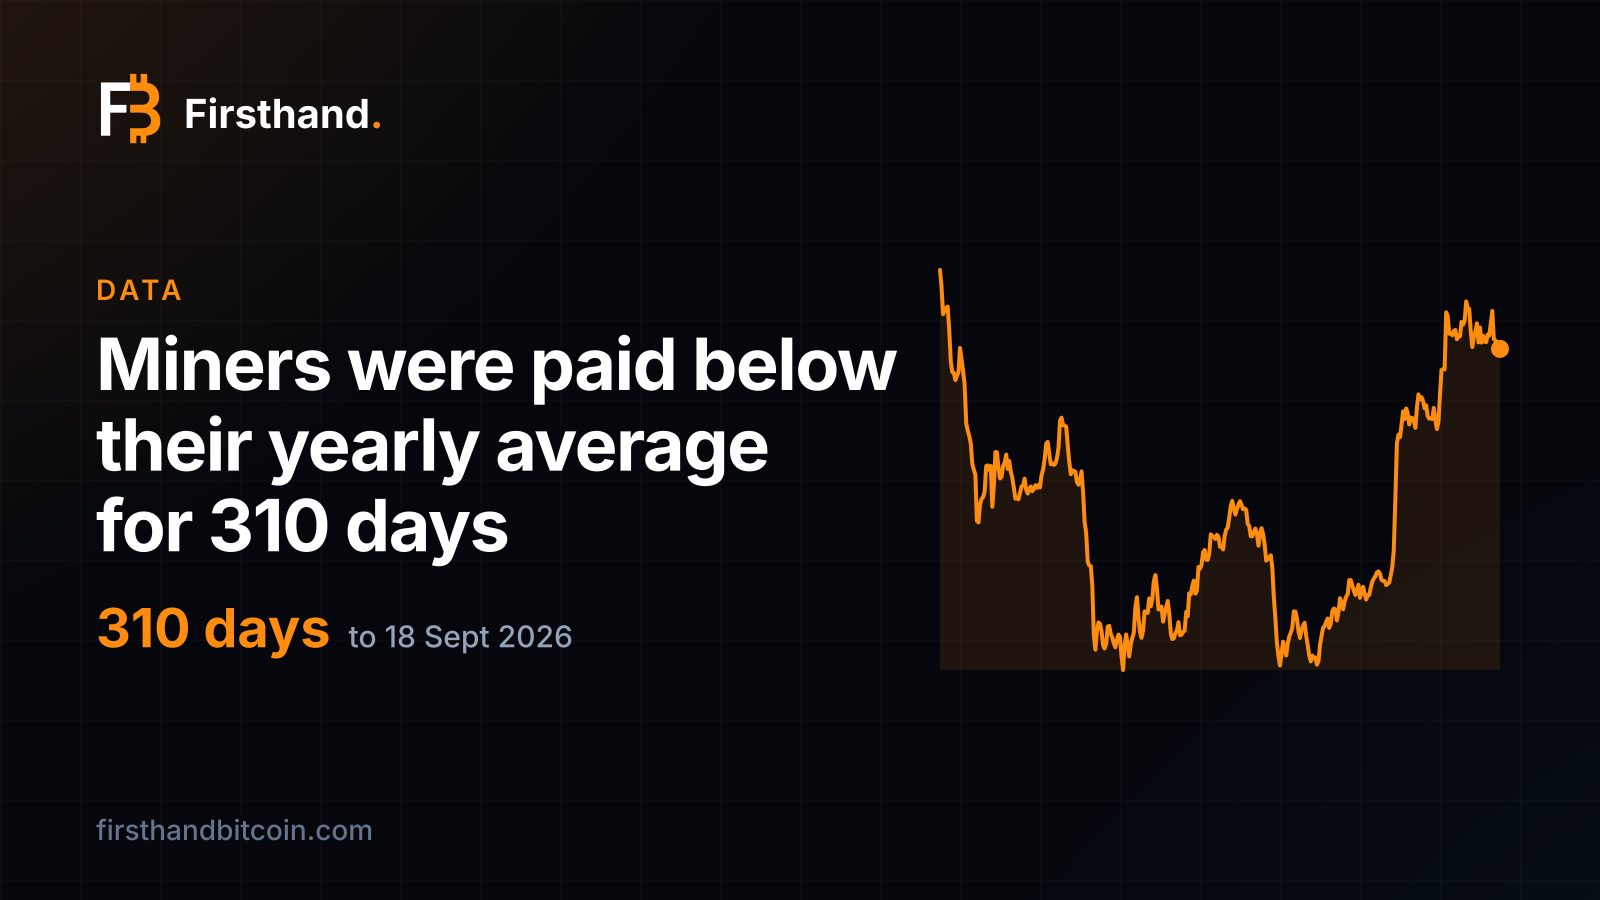
Miners were paid below their yearly average for 310 days
The Puell multiple divides the dollar value of the bitcoin issued each day by its average over the previous 365 days. Above 1, miners are earning more than their usual year. Below 1, less. It was below 1 on every day from 13 November 2025 to 18 September 2026: 310 days in a row.
The multiple bottomed at 0.64 on 24 February 2026, when bitcoin closed at $63,709. It crossed back above 1 on 19 September and has stayed there for 39 days. On 27 October it read 1.03, with bitcoin at $80,000 against a one-year average of $77,504. Galaxy's research head Alex Thorn made a related point on Tuesday, that bitcoin is back above its 50-week average after 44 weeks under it, as CoinDesk reported.
It is the third-longest run in our record
Our series lets the multiple be measured from late 2013. Since then it has gone under 1 for five months or more seven times. Only 2014 to 2015 (426 days) and 2022 to 2023 (342) lasted longer than this one. Three of the seven started on a halving day, when issuance was cut overnight: July 2016, May 2020 and April 2024. The other four began with the price falling: 2014, 2018, 2022 and November 2025.
Take difficulty on the first day of each run and on the day after it ended. It rose in every one of the first six, by 13% in 2018 to 209% in 2014. In the 310 days to 18 September it went from 152.27 trillion to 132.76 trillion, down 13%.
Of the four slumps that began with a falling price, three ended with a bigger network. This one ended with a smaller one.
| Run under 1 | Days | Bitcoin price, start to end | Difficulty over the run |
|---|---|---|---|
| Aug 2014 – Oct 2015 | 426 | $498 to $262 | +209% |
| Jul 2016 – Dec 2016 | 166 | $663 to $802 | +45% |
| Aug 2018 – May 2019 | 278 | $7,982 to $5,537 | +13% |
| May 2020 – Oct 2020 | 169 | $9,318 to $13,298 | +24% |
| Apr 2022 – Mar 2023 | 342 | $44,616 to $23,088 | +52% |
| Apr 2024 – Nov 2024 | 205 | $64,286 to $79,174 | +18% |
| Nov 2025 – Sep 2026 | 310 | $101,534 to $78,980 | −13% |
The network shrank because machines switched off
Difficulty only falls when blocks have been arriving slowly, which means hashrate left. Our difficulty chart shows the record of 155.97 trillion on 29 October 2025, two weeks before the run began. Our hashrate series, which is an estimate and noisy day to day, tells the same story: its 30-day average went from 1,109 exahash a second on 13 November to 918 on 18 September, down 17%.
Machines are not switched off at random. A machine goes dark when what a petahash earns no longer covers the power it draws, so the first to leave are the least efficient and the ones on the dearest electricity. The ones that stay are the ones whose cost per coin still clears.
Earlier slumps did not do this. In 2022 and 2023 the 30-day average rose 54% while the multiple was under 1. In 2018 and 2019 it rose 17%. Miners then kept adding machines through the low, and difficulty kept climbing. We have written about the 219 days of capitulation inside this run, and about how difficulty has won back half of its fall.
Fewer machines meant more coins for each one
Hashprice is what a petahash earns in a day. Measured in bitcoin on our hashprice chart, it was 0.000415 on 13 November 2025 and 0.000496 on 18 September 2026, a rise of 20%. The price of bitcoin fell 22% over the same run, from $101,534 to $78,980. So the dollars fell and the coins went up.
In dollars the picture is the opposite. A petahash earned $42.16 a day on 13 November 2025 and $39.20 on 18 September, 7% less, because the price fell further than the coin count rose. Across the whole run, miners as a group took in an average of $35.8 million a day on our miner revenue chart, against $48.2 million a day in the 365 days before it, down 26%.
That is the mechanism of a long slump. Machines that cost more to run than they earn are switched off, difficulty drops, and the ones left on share the same issuance among fewer hashes. Every petahash still hashing was paid in more bitcoin than at the start, which is why efficient machines on cheap power keep stacking coins when the price is low.
The network has already won 10% back
Difficulty stood at 140.58 trillion on 27 October, 10.3% above its low of 18 September. The 30-day hashrate average was about 1,023 exahash, up 11% on the low. Hashprice in bitcoin on 27 October was 0.000449, nearly 10% under the September figure, because the extra machines are sharing the same issuance again. Bitcoin closed at $80,000.34 that day.
That is six weeks of recovery against ten months of decline, and it is the number to watch on the difficulty chart.
What it means for a miner
A year under the average did not cost a machine its coins. The coins per petahash went up while the dollar price went down. The miners who left were the ones with the highest cost to make a coin, and the network they left behind paid the rest better in bitcoin.
The cost to make a coin is the number that decides which side of that line a machine is on. On our best case, an Antminer S23 XP Hyd at 8.9 J/TH on Nigeria's 3.9¢ power, electricity makes a bitcoin for about $18,540, 23% of the $81,046 market price on 28 October. That is electricity only, at today's hashprice, and output is not guaranteed. A low price is when efficient machines on cheap power stack the most coins for each dollar, and coins kept are the ones that count.
A year under the average, and a petahash still ended it earning 20% more bitcoin.
Sources and further reading
- Now is the time to accumulate bitcoin, Galaxy says — CoinDesk, 27 Oct 2026
Disclosure
Firsthand Bitcoin sells and hosts mining hardware, including this machine. No manufacturer, distributor or affiliate programme paid for or reviewed this page and we take no commission on the links above. Historical figures are computed from daily bitcoin price and network hashprice, each day valued at its own prices. Nothing here is investment advice.