Data insight · Nov 15, 2026 · 5 min read
Bitcoin is back under its 200-week average, a line 9% higher than at the June low
Bitcoin read $64,096 on the morning of 15 November, 5.6% under its 200-week average of $67,924 and further under it than on any close of the summer dip. The line itself has risen 8.8% since 30 June, and difficulty is back where it was that day, so a petahash earns what it did at the year's low.
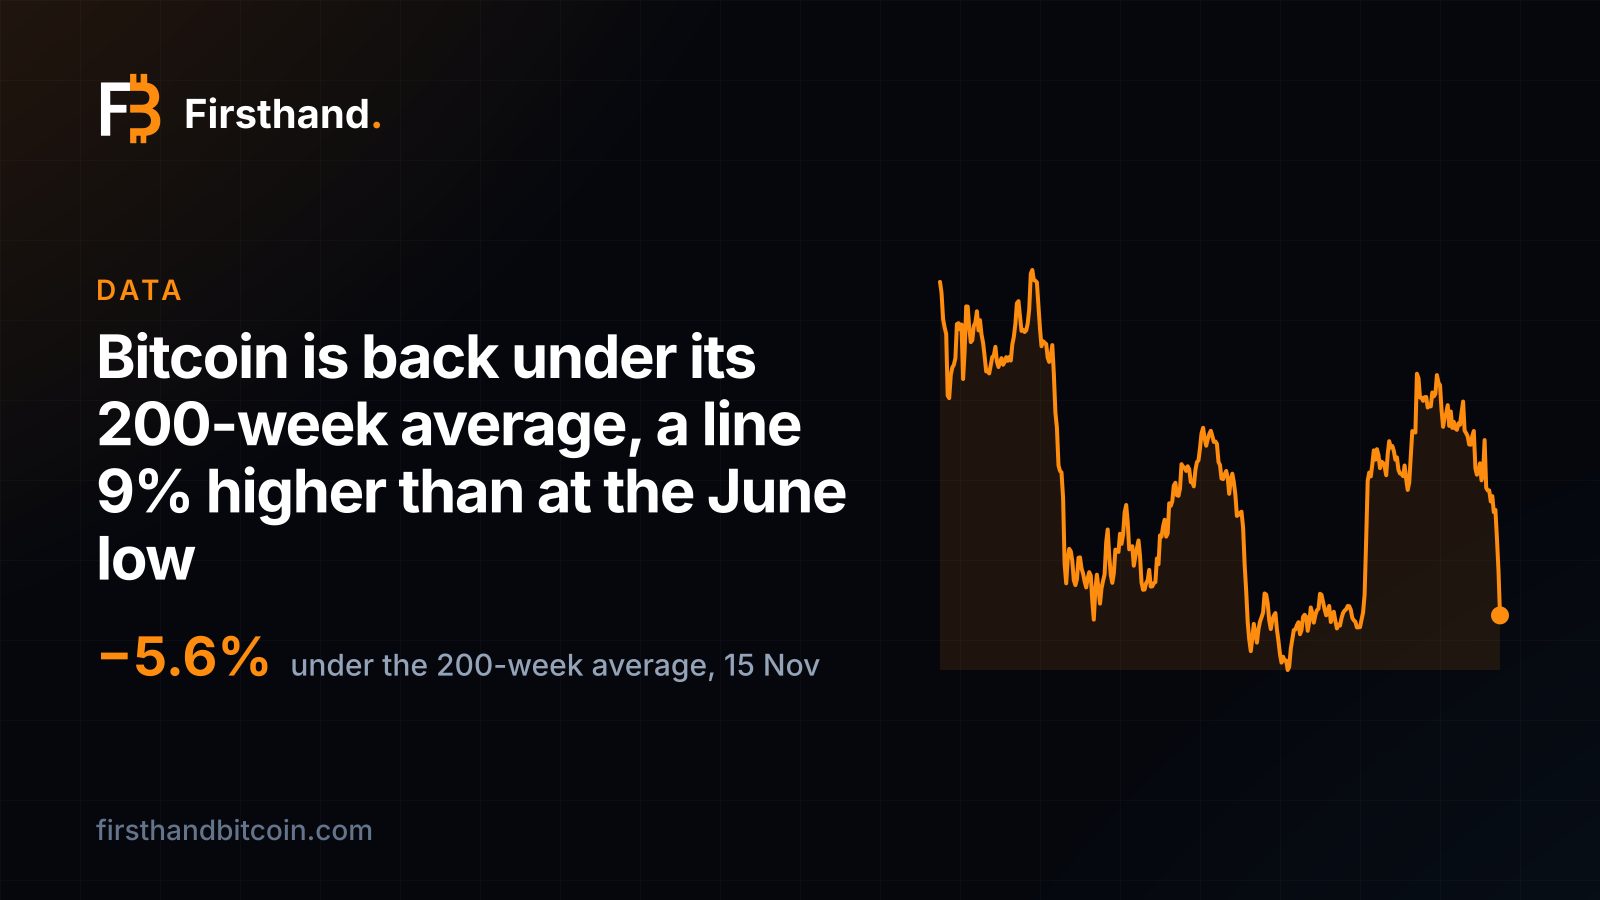
This morning bitcoin was 5.6% under its 200-week average
The 200-week average is the mean of the last 1,400 daily closes, a little under four years of prices. On the morning of 15 November it stood at $67,924 on our moving averages chart, and bitcoin read $64,096: 5.6% under it.
It got there in two days. Bitcoin closed at $71,366 on 13 November, 5.2% above the line, and at $68,232 on 14 November, 0.5% above. Overnight it fell to about $63,300 in Asian trading, Bloomberg reports via The Edge, as $1.32 billion of bitcoin longs were force-closed over Friday and Saturday on our liquidations chart. Today's news recap has the weekend in full.
Before this morning, bitcoin had closed above the line every day since 18 August, 89 closes in a row. This morning's figure is a reading, not yet a close; it already sits further under the average than any close of the summer, whose deepest was 5.5% under on 30 June.
The line is 9% higher than it was at the June low
An average of four years of closes climbs whenever today's price is above the prices dropping out of the window, and for most of 2026 it was. On 30 June, the day of the year's lowest close, the 200-week average was $62,452. This morning it is $67,924, up 8.8%.
Over a longer span the climb is steeper. The average was $40,856 on 15 November 2024 and $55,196 on 15 November 2025. In a year it has risen 23%, in two years 66%.
So the floor bitcoin has come back to is not the floor it touched in the summer. This morning's $64,096 is 8.6% above the $59,014 close of 30 June, and still under the line, because the line has moved up faster than the price has held.
Bitcoin is 8.6% above its June low and still under the line, because the line has risen faster.
It has spent 345 closes under the line since 2016, most of them in 2022
Our price record gives a 200-week average from 31 October 2016, the first day with 1,400 closes behind it. Since then bitcoin has closed under it on 345 days, in three runs: three days in March 2020, 318 days between June 2022 and October 2023, and 24 days this summer.
The runs differ more in depth than in count. The 2022 break reached 33.6% under the line on 22 November 2022, when bitcoin closed at $15,930. The summer of 2026 never went beyond 5.5%, and its 24 closes came in seven short stretches, the longest ten days from 24 June to 3 July.
| Run | Closes under the line | Deepest close | Under the average by |
|---|---|---|---|
| March 2020 | 3 | 18 March 2020, $5,358 | 2.4% |
| June 2022 – October 2023 | 318 | 22 November 2022, $15,930 | 33.6% |
| June – August 2026 | 24 | 30 June 2026, $59,014 | 5.5% |
| November 2026 | this morning's reading | 15 November 2026, $64,096 | 5.6% |
The faster 200-day average broke first, on 13 November
The 200-day average, the mean of the last 200 closes, is the shorter trend. Bitcoin closed above it every day from 20 August to 12 November, 85 closes. On 13 November it closed at $71,366 against an average of $73,089, and the run ended.
Rich Rosenblum, co-founder of the market maker GSR, called the weekend's fall a technical move set off by that break, The Edge reports. Two days later the price had reached the slow line too. The faster line is now $72,985, 13.9% above this morning's price.
Difficulty is back at its June level, so a petahash earns the same BTC
Here the two lows look alike. Difficulty was 133.87 trillion on 30 June and is 134.82 trillion this morning, 0.7% higher, after the 9.13% cut of 14 November on our difficulty chart. The network has given back almost all of the rise of September and October.
A petahash therefore earns almost exactly what it earned at the June low. On our hashprice in bitcoin chart it was 0.000474 BTC a day on 30 June and is 0.000469 this morning, 1% less. In dollars, $27.95 a day then and $30.07 now, because the price is higher than it was at that low.
That is the difference from 2022, when difficulty rose 43.8% between the first and last closes under the line and every petahash earned fewer BTC as the bear market went on. Miners kept installing machines through that low; through this one they have been switching them off. In 2026 the network has shrunk into the price twice, and each time the machines still running took a larger share of every block.
What it means for a miner
The 200-week average is what four years of bitcoin's closes come to. A machine's own number is much lower. On our best case, an Antminer S23 XP Hyd at 8.9 J/TH on Nigeria's 3.9 cents, electricity makes one BTC for $17,756 at today's hashprice: 26% of the 200-week average and 28% of this morning's price. Our cost-to-mine chart carries the same line for every class of machine.
A price under the slow line and a petahash earning the BTC it earned at the June low is the mix in which an efficient machine on cheap power stacks the most for its electricity. The keeper's arithmetic behind that is in nobody sells the BTC to pay the power bill.
We do not forecast where the price goes from here; the summer dip lasted 24 closes, and the 2022 one 318. Output is not guaranteed. What does not depend on the price is how many BTC a petahash earns this week, and that is 10% more than last week.
One BTC costs $17,756 of electricity on the best machine: about a quarter of the 200-week average.
Sources and further reading
- 200-day and 200-week averages — Firsthand Bitcoin data, 15 Nov 2026
- Hashprice in bitcoin, per petahash per day — Firsthand Bitcoin data, 15 Nov 2026
- Mining difficulty — Firsthand Bitcoin data, 15 Nov 2026
- Bitcoin tumbles to three-month low as liquidations accelerate — Bloomberg, via The Edge Malaysia, 15 Nov 2026
Disclosure
Firsthand Bitcoin sells and hosts mining hardware, including this machine. No manufacturer, distributor or affiliate programme paid for or reviewed this page and we take no commission on the links above. Historical figures are computed from daily bitcoin price and network hashprice, each day valued at its own prices. Nothing here is investment advice.