Data insight · Oct 9, 2026 · 4 min read
ETFs and longs had their worst days since 25 June. Bitcoin is 35% higher than it was then.
On 7 October the US spot ETFs lost $487 million, their largest outflow since 25 June. The next day bitcoin longs lost $272 million, the most since the same date. In June that pair came with bitcoin at $60,470. This time it is 35% higher and the market is calm.
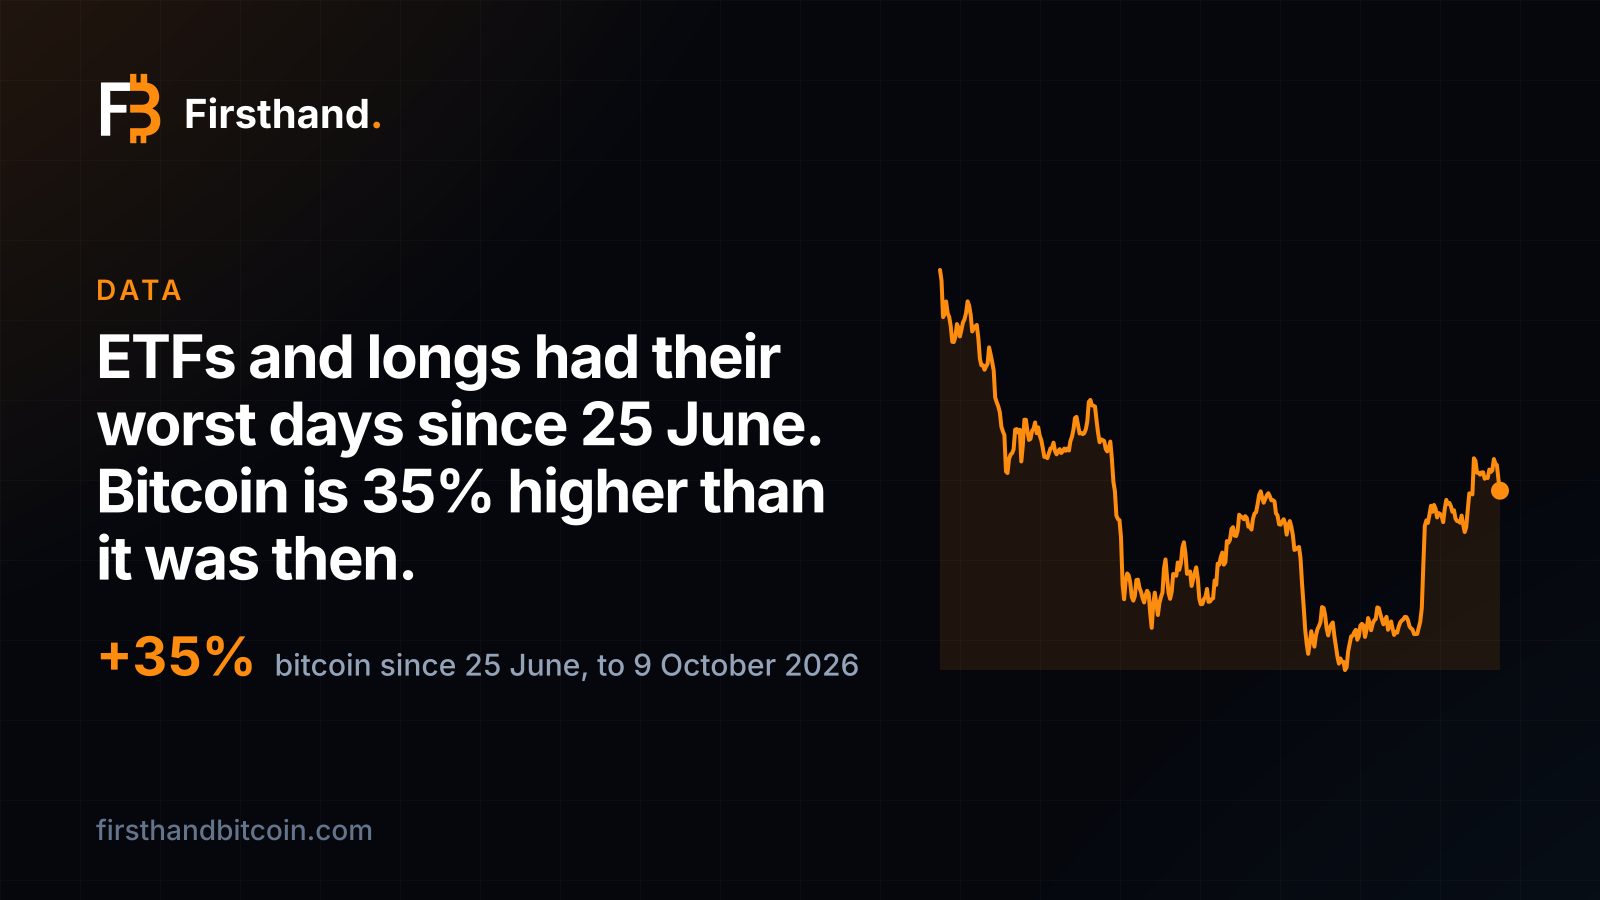
Two readings in two days, and both are the biggest since 25 June
The US spot bitcoin ETFs lost $487.1 million on Wednesday 7 October on our ETF flows chart. Their last bigger day was 25 June, when $691.7 million left. Bitcoin.com News put the same day at $487.07 million, citing SoSoValue, and called it the heaviest since 25 June.
On Thursday 8 October, bitcoin longs force-closed on futures exchanges came to $272.4 million on our liquidations chart, against $31.5 million of shorts. Their last bigger day was also 25 June, when $337.9 million closed. In the 195 days of liquidation data we hold, only seven days have been bigger, all in June.
Two readings, two days, one date they both beat: 25 June.
Three funds account for 85% of the outflow
BlackRock's IBIT lost $207.67 million on 7 October, Fidelity's FBTC $105.15 million and ARK 21Shares' ARKB $101.71 million, Bitcoin.com News reported. Together that is $414.5 million of the $487.07 million. Grayscale's GBTC lost $39.29 million, Bitwise's BITB $27.59 million, and two smaller funds a few million between them. No fund took in meaningful money.
The outflow came after the funds' best stretch of the year. From 17 August to 22 September they took in a net $5.09 billion on our series, which the squeeze piece covers. From 23 September to 6 October the net was another $942 million in, so this one day took back about half of the fortnight before it.
In June the same pair came with a market at its lows
Bitcoin was $60,470 on 25 June, and the Fear & Greed Index read 12. Perpetual funding was negative, at -2.6% a year, so shorts were paying longs. Futures open interest stood at $25.1 billion.
The first cluster came earlier, from 1 to 6 June. Bitcoin fell 16%, from $72,280 to $60,771, in six days. Bitcoin longs lost $2.43 billion over those days and the ETFs lost $1.72 billion.
The second cluster ran from 23 to 26 June: four straight days of ETF outflows totalling $1.72 billion, with $652 million of longs closed on 24 and 25 June. Bitcoin went from $64,318 on 22 June to $59,706 on 26 June, a fall of 7.2%. That is the run of days that 7 October and 8 October are measured against.
This time the market is neither frightened nor stretched
Bitcoin read $81,673 on our series this morning, 4.8% below its $85,771 close on 6 October. Between 5 and 7 October the ETFs lost a net $458 million and on 7 and 8 October longs lost $446 million. In June's first week the matching figures were $1.72 billion and $2.43 billion, with a price fall more than three times as large.
Fear & Greed was 64 on 8 October and 59 this morning. Funding on 8 October was +5.9% a year, so longs were paying a little, and open interest was $32.7 billion. The MVRV ratio, bitcoin's price against what its holders paid, was 1.52 against 1.12 on 25 June.
The leverage had already been coming down
Futures open interest, the value of every open bitcoin position, was $38.4 billion on 22 September, when bitcoin read $86,608. It was $32.7 billion on 8 October, 15% lower, while the price was only 3.8% lower. Between 23 September and 6 October bitcoin longs had lost another $582 million in smaller doses, the biggest day $131 million.
That is why a fall of under 5% could clear $272 million in a day without the market breaking. Our open interest chart shows the positions that were left on 8 October were fewer, and paying close to nothing to be held. The squeeze piece explains how forced closing feeds on itself, and why it needs a crowd leaning one way.
The last two times, the readings did not mark a low on the day
After the 2 June readings, bitcoin fell another 11.8% over four days. After 25 June it went on to a low of $59,014 on 30 June, five days later, 2.4% under the 25 June price. Thirty days after 25 June it was 6% higher.
Two outcomes do not make a rule, and the readings say how much money left, not where the price goes next. What the comparison does show is how different the starting points were: bitcoin was at $60,470 then and is $21,000 higher now.
What it means for a miner
The coins a machine mines did not move with the price. On 25 June a petahash earned 0.000507 bitcoin a day on our hashprice chart. On 8 October it earned 0.000477, 6% less, because difficulty rose from 124.9 to 132.7 trillion. Each coin is worth 35% more than on 25 June, so the same petahash earns $38.94 a day at this morning's price against $30.63 then.
The most efficient machine in stock on our cheapest power, the Bitmain Antminer S23 XP Hyd at 8.9 J/TH in Nigeria at 3.9¢ a kilowatt-hour, makes a coin for about $17,900 of electricity at today's hashprice, against $81,673 to buy one. Our hashprice guide explains the number. A week that sends traders out is a week to keep the coins you mine. Output is never guaranteed.
The next difficulty adjustment is the number to watch for output. Our difficulty page estimates it in about eight days at +4.3%, which would take difficulty to about 138.4 trillion and a petahash to roughly 0.000457 bitcoin a day if nothing else changed. Coins per petahash have eased since June as the network grew, and it is the price that has lifted the dollar figure.
A petahash earns 6% fewer coins than on 25 June. Each coin is worth 35% more.
Sources and further reading
- Bitcoin ETFs Lose $487M in Heaviest Daily Outflow Since June — Bitcoin.com News, 8 Oct 2026
- Bitcoin ETFs flip October flows negative after $487M outflow — Cryptopolitan, 8 Oct 2026
- Bitcoin Price Drops Below $81K as Crypto Liquidations Top $1.1 Billion — Bitcoin.com News, 8 Oct 2026
Disclosure
Firsthand Bitcoin sells and hosts mining hardware, including this machine. No manufacturer, distributor or affiliate programme paid for or reviewed this page and we take no commission on the links above. Historical figures are computed from daily bitcoin price and network hashprice, each day valued at its own prices. Nothing here is investment advice.